A deploy on our platform logged this and moved on:
[02:30:09] Error: Command timed out after 600000msTen minutes, cap hit, step failed. The orchestrator marked the deploy dead and released it. Six minutes later someone went looking at the box, and the build was still running. Not a second build. That one — the one the log had already declared dead, sixteen and a half minutes earlier.
Two things were wrong, and the second one is the one worth your time.
The build had not run out of time. It had stopped.
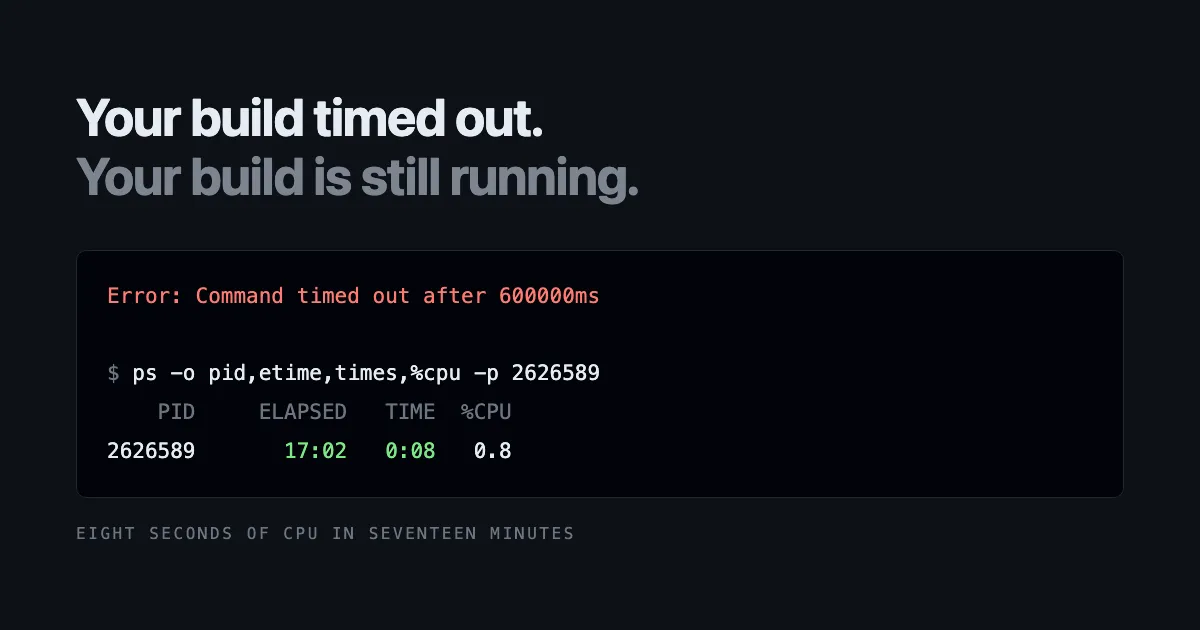
The obvious reading of "timed out after 600000ms" is that the work needed more than ten minutes. The obvious fix is more minutes. Both were wrong, and one command said so:
$ ps -o pid,etime,times,%cpu -p 2626589
    PID     ELAPSED   TIME  %CPU
2626589       17:02   0:08   0.8
Eight seconds of CPU across seventeen minutes of wall clock. A build that genuinely ran for ten minutes has minutes of CPU behind it. Eight seconds is a process that started, did a little, and stopped.
Three more checks agreed. It had spawned no worker processes, where a real build of that project runs several. It held no sockets at all, so it was not blocked waiting on a database. And its log ended at the framework's startup banner — it had never printed the line that comes next.
So the number in the error message was the cap, not the duration. It was the only number in the log, it looked like a measurement, and it described the limit rather than the work.
This matters because hung and slow want opposite fixes. More time helps a slow job. More time extends the damage of a hung one — and in this case it would have, because of the second problem.
The timeout killed the shell, not the container
The step was invoked roughly like this, which is an extremely ordinary thing to write in Node:
exec(`docker run --rm -v "${dir}:/app" node:22-alpine sh -c "${cmd}"`,
     { timeout: 600000 },
     (err, stdout, stderr) => { /* ... */ });
Node's exec runs your command through a shell. When the timeout fires it sends SIGTERM — to that shell. Nothing else.
The docker run client the shell started is a grandchild. It is not in the signal's path. It survives, still attached to its container, which keeps building. The callback fires with a timeout error, your code logs a failure and cleans up, and the work you believed you had killed carries on with nobody watching it.
On a build that is merely wasteful, that is a stray container. On a build that mutates the directory it was building in, it is worse: the orphan held its workspace, and it held the queue behind it, so the redeploy that would have replaced it never started. The deploy did not fail and stop. It failed, said so, and then kept going.
The fix is the process group
Spawn the child in its own process group, and signal the group rather than the process:
const child = spawn('/bin/sh', ['-c', command], { detached: true });

const killGroup = (signal) => {
  try {
    // Negative pid = the whole group, not just the shell.
    if (child.pid) process.kill(-child.pid, signal);
  } catch { /* already gone */ }
};

const timer = setTimeout(() => {
  timedOut = true;
  killGroup('SIGTERM');
  setTimeout(() => killGroup('SIGKILL'), 10000).unref();
}, timeoutMs);
detached: true gives the shell its own process group, so process.kill(-pid) reaches everything it started. The SIGTERM now lands on the docker client, which proxies it to the container by default. The delayed SIGKILL covers anything that ignores the first signal.
Test whether the grandchild is dead, not whether you called kill
This is the part most likely to be skipped, and the part that decides whether the bug comes back.
A test that asserts "kill was called" passes against code that kills the wrong thing — which is precisely the bug. The test has to assert the effect: run a command whose grandchild outlives its shell, time it out, wait past the point the grandchild would have acted, and check that it did not.
Then add the control that makes the result mean something: run the old implementation through the same test and assert that it still leaks. Without it, a green result is equally consistent with a test that cannot detect the problem at all. With it, green means the new code fixed something the test can see.
What to look at in your own pipeline
Three checks, none of which take long:
Does anything survive your timeouts? After a step times out, run pgrep -af for the command and docker ps for stray containers. If something is still there, your timeout is reporting a kill it did not perform.
Can you tell hung from slow? Put CPU time next to wall clock in whatever you use to inspect a stuck job. ps -o etime,times is enough. The two failures look identical in a log and take opposite fixes.
Does your error message name a limit or a measurement? "Timed out after N" contains one number and it is the cap. It is not evidence that the work took N. We reasoned from that number for a while before checking it.
Why we are writing this up
Nothing here is exotic. exec with a timeout is in a great many deploy scripts, and running Docker from Node is ordinary. The failure survived because both halves are quiet: a timeout that reports a failure it did not cause, and a hung process that looks exactly like a slow one.
The generalisable form, which we now apply to guards of every kind: ask what the mechanism looks like when it fails. If the answer is "the same as when it works", it needs something that proves it acted — not merely that it ran.
DeployBase is managed hosting for WordPress, Laravel, Node.js and static sites, running from a single data centre in Helsinki, Finland. One product in four sizes: Starter at $5.99/month (1 GB RAM, 0.25 vCPU, 20 GB SSD, 1 TB bandwidth), Pro at $11.99, Business at $23.99 and Enterprise at $47.99. SSH access and Git deployment start at Pro; staging environments start at Business. MySQL, PostgreSQL, Redis, MongoDB and scheduled cron jobs are available on every plan. See the plans.